Click here to get this post in PDF
The online space has afforded us opportunities for advertising like never before. There are many perks to pivoting towards online ads: its ease of use, reach, and affordability are top-notch, bar none. Not to mention the fact that almost anyone can implement campaigns by themselves if they wanted to.
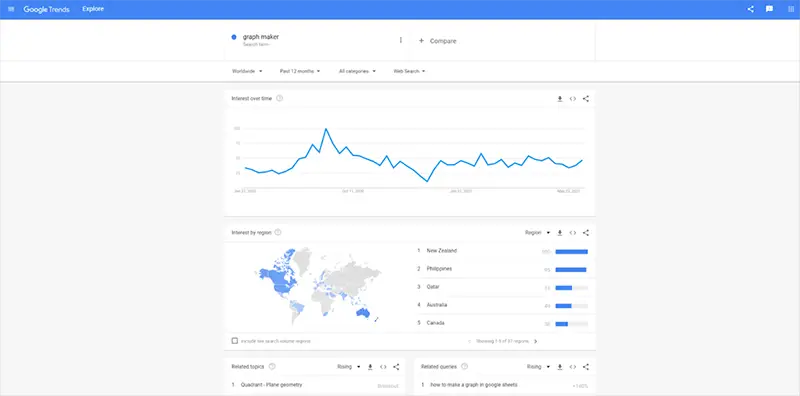
But perhaps one of its most underappreciated aspects is that it is, fundamentally, a data-driven platform. By tracking users, advertisers can quickly see how their target audience reacts to their material in real-time. Automatic graph maker tools such as those found in all kinds of analytics suites can show this valuable data on demand and showcase trends and insights that can then be translated into all sorts of activities.
So, needless to say, data visualization, in general, plays a large part in creating compelling and convincing advertising material.
How Data Visualization and Marketing Strategy Go Hand in Hand?
Before we dive into how both of these elements are essential in creating persuasive advertising material, let’s tackle them individually.
Data visualization is defined as the visual or graphical representation of data, while a marketing strategy can be described as the plans one makes to promote a product or service. Marketing strategies are often composed of multiple ads.
Now, while marketing is possible without data analysis or visualization as done in the old days, it is certainly more efficient to function with it instead. It is especially true for online ads. By combining essential bits of information such as your targets’ lifestyles, interests, trends, behaviors, and wants, you can better seek out who exactly will be more likely to engage with your ad and, subsequently, your product. In addition, it will also allow you to set up the required necessary parameters to ensure that your ads are only targeted towards people who will find them relevant.
This information is so accessible that it would almost be a waste not to use it, and all advertisers nowadays are taking advantage of that fact. This method is what we call data marketing.

Why Use Data Marketing?
The primary benefit data marketing brings to the table lies in its reliability. Because of the precision integrating your data can bring to your marketing strategy and your ads, it stands to reason that return on investment and the general success of your efforts is more pronounced.
Not only will you be able to understand your audience’s biases, but given enough data over time, you may even be able to model then predict them too. In addition, having a solid awareness of how they act will also allow you to identify the most optimal channels to host your ads.
Again, skipping all this is possible, and trial-and-error remains a viable solution, but working with data improves everything significantly. Therein lies the key to persuasive ads: understanding the data and the insights it’s offering relative to your audience or your product or service, then pivoting your ads towards it.
Understandably, the thought of doing this may be daunting to some, especially for those who aren’t as savvy with the minutiae of data analysis. But that’s what the visualizations are for, and they are present in all modern analytics suites to help make them as user-friendly as possible.
Communicating Information with Charts or Graphs
Most, if not all, analytics dashboards for ads have local graphs or charts to help with the data analysis process. But because they’re premade, they might not be able to display the precise information you need. In addition, they can be somewhat bloated or complicated to understand for some users, particularly for those who aren’t as experienced with these sorts of tools.
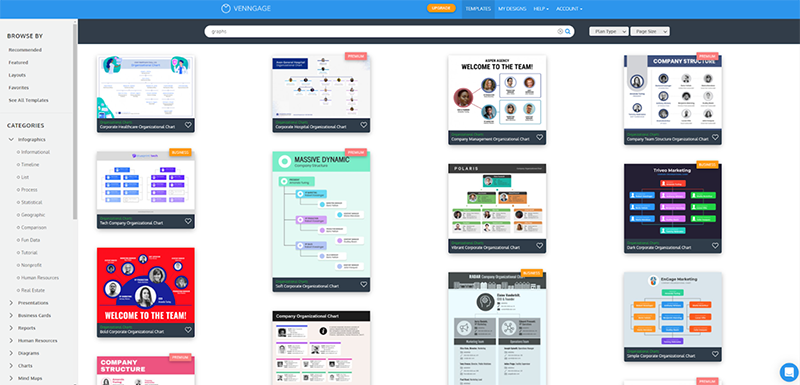
That’s why customized data visualization is so important. And while there are numerous ways of going about it, the easiest is arguably by using online tools such as Venngage to quickly and easily create content-rich images that can show complex information in a clear and digestible manner for others to understand.
By framing your data like this where everything is laid out, comprehending and communicating them is more straightforward. That makes it so that gleaning key insights such as trends, patterns, relationships, or even outliers can be identified quickly without going through the trouble of running an analysis every time, and campaigns or ads can be made more efficiently.
Persuasive Ads Using Graphs Is All About Storytelling with Data
Regardless of what you gain from your data, one thing is for sure: it would be best to make a story out of it and use that within your ad.
Turn your findings into something engaging. It’s about answering the two main questions: “what is my data saying, and who would care?”
Once you’ve identified those two key elements through visual analysis and visualization, integrate them into your ad, and it’s smooth sailing from there.
You may also like: 6 Clever Things You Could Be Doing With a Customer Data Platform