Click here to get this post in PDF

The importance of WIFI Networks cannot be overemphasized. Over the years, wireless networks have become an intricate component of business structures, and with an overwhelming upward trend, businesses seem to prefer WIFI networks over other alternatives. What a lot of people think, however, is that visualizing their Wi-Fi would be very difficult and would require only the help of experts or paid professionals. This is not true.
Today, you not only can easily visualize your Wi-Fi network with no professional help whatsoever, but you can also easily perform professional wireless site surveys, analyze your own Wi-Fi network, create coverage heat maps, view your channel usage/overlap, and see all your coverage voids. What is most amazing about this is that you do not need any sort of computer engineering skill or need to be a network expert. With the introduction of Wi-Fi heat maps, you can comfortably manage all your network inconsistencies and visualize your Wi-Fi network without difficulty.
What is a Wi-Fi heat map?
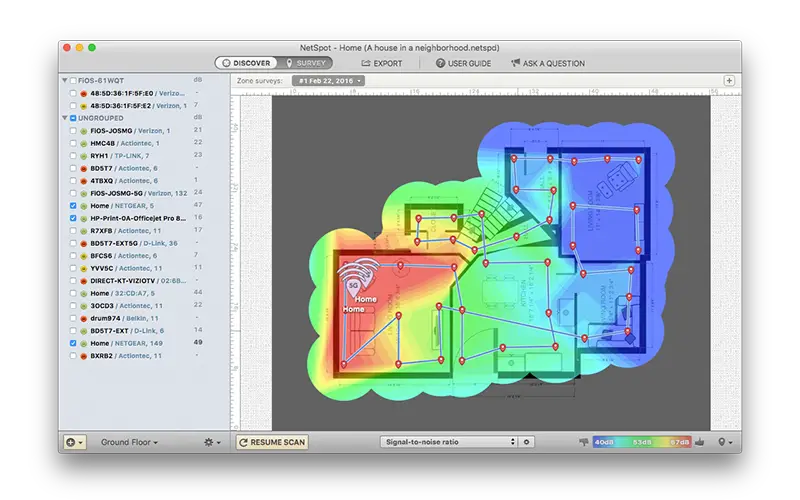
A Wi-Fi heat map contains the map of various wireless signal coverage and their strengths. Using a Wi-Fi heatmap enables you to see a graphical representation of a wireless signal in a room, a building, or even a city and can tell where your network is the strongest. With a Wi-Fi heatmap, you can comfortably achieve the kind of network you crave without having to go through a lot of guesswork.
Sometimes, creating a heat map from scratch can be a bit too daunting and, in most times, not accurate. In order to get the best out of a Wi-Fi heatmap, making use of the software is the best way towards achieving the best results there are.
W-Fi Heatmapping software
This software allows you to automatically create a Wi-Fi heat map from your preferred device in just a matter of minutes. All you need to do is first have the software installed on your device and then take a walk around the area you intend to map, and in no time, the entire area would be mapped on your device.
There are various kinds of mapping software, but only a few can boast about authenticity and versatility. The Netspot is one of the best Wi-Fi heat mapping software there is as it has embedded in it every single thing you need to ensure that you maximize and get the best out of your Wi-Fi Network.
How does Wi-Fi heatmap work?
Using the WiFi heatmapper is pretty straightforward. Once you have the application installed on your device; a laptop, or a phone, you enter the premises you wish to map. The application either loads up a pre-existing map or helps you create a new map of that area from scratch. All you need to do is move from one location to the other with your device whilst the application helps take records of the areas with the highest signal strengths.
How to read a Wi-Fi heatmap
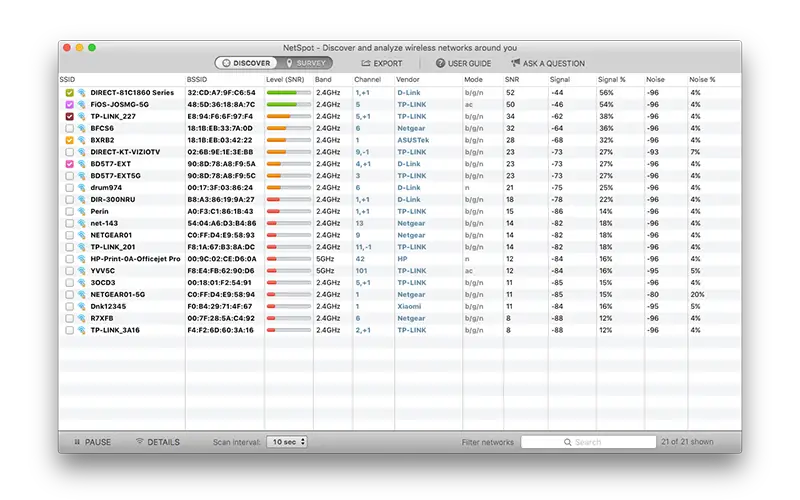
The Wi-Fi heatmap comes with a simple-looking user interface that helps you easily visualize and read your Wi-Fi network. With the Netspot, you can tell which areas provide the best signal strength by the color represented on the map. Asides helping you tell which of the area can provide you with the best Wi-Fi network, the Netspot helps you visualize your Wi-Fi network better by:
- Helping you highlight your signal level and comparing it to your noise level
- With the application installed on your device, the Netspot helps you measure the quality or signal strength on your device
- Helps you detect the number of access points at each measurement point
- Helps you highlight your noise levels
- Helps you visualize and highlights co-channel interference that is coming from other radio transmitters
The Netspot would basically do all the work required to ensure that your area is properly mapped and with a very friendly interface. Visualizing your Wi-Fi network is not only very easy by just being a click away, it is also very efficient because of the quality of the app
How to use Netspot
There is nothing as good as having a fully optimized Wi-Fi network. Using Netspot helps you to access, analyze, and optimize all your major wireless deployments whilst promising you proper Wi-Fi planning.
With a good Wi-Fi heatmap, you can visualize the following;
- Signal to noise ratio
- Quantity of access points
- Signal to interference ratio
- Noise level
- Signal level
With Netspot, however, you not only get to properly visualize your Wi-Fi networks, but you also get to upload a map of your network area, with an option to draw it with Netspot’s handy tools, if this is your preferred choice. It also offers other scanning and troubleshooting visualizations.
All in all, the Wi-Fi heatmap software is one technological innovation that you should be grateful for. Now, you can easily tell which area in your map has the best signal or the weakest signal, and through the help of a friendly user interface, you are able to visualize and view your Wi-Fi network, helping you to easily pinpoint areas in your network map that requires your outmost attention.
You may also like: Wi-Fi 6 – The Next Generation of Wi-Fi


