Click here to get this post in PDF
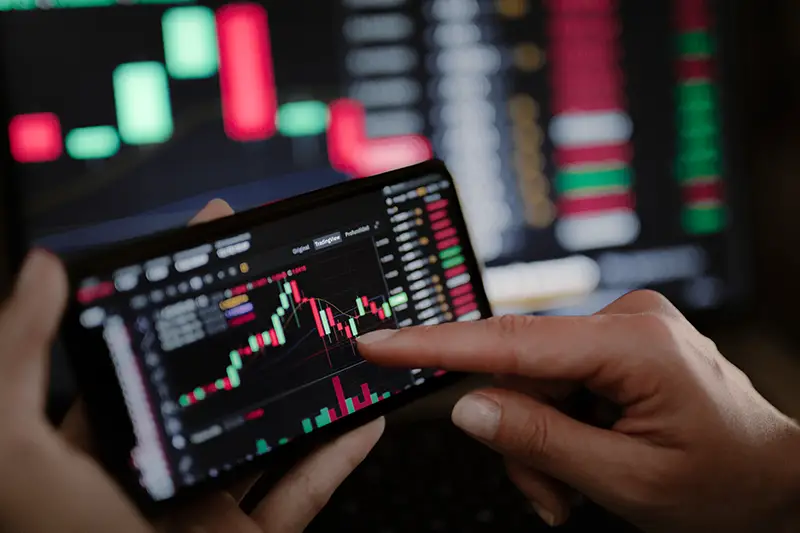
Are you trading on Cryptocurrency without any knowledge of reading Crypto charts? This is like you are alone on a boat and do not know how to swim. There is nothing so harmful as innocence; the same goes for trading Cryptocurrencies. Are you trading with Cryptocurrency? You could facilitate your crypto trading with the help of Crypto profits. This trading app can help you facilitate trading on Crypto safely.
If you have decided to trade on Cryptocurrency, you ought to do your homework. You need to learn how to read the charts. The article discusses the nitty-gritty of reading crypto charts. Therefore stay till the end to know all the things.
What Is A Crypto Chart?
This ought to be your first question with the Cryptocurrency investment. Crypto charts are the graphical representation of the price, the volumes, and the time intervals. There are different types of charts available to you. Though these chart patterns are different from one another, you can understand them with a little knowledge of them.
Parts Of The Crypto Chart
There are distinctive parts of a Crypto chart, and let us take note of these individual elements here.
The trading pair of the Cryptocurrency denotes the base currency (BTC) and the quote currency (USDT) used in a market. The Crypto chart’s current price denotes the base currency’s price. You understand the rise and the fall of the price is based on a comparison with the price that is kept before 24 hours. These figures change rapidly.
The time increments denote the unit of time. So here you understand the price of Cryptocurrency drifts from one minute to that one month. The Pie chart represents a chart which shows the rise and fall of Cryptocurrency over a period of time.
Patterns Of Crypto Chart
There are some popular Crypto charts that you have to understand how to read them. You need to know how to read these in order to get a good grasp on the movement of prices. Let’s discuss a few of them here.
1. Head And Shoulders
The Head and Shoulder pattern shows the peak and the bottom of one particular trend. When the patterns show a button trend, you can call it an inverted head and shoulder pattern. So try to see these and understand the trends that you have with the patterns.
2. Wedges In Crypto Patterns
The pattern is similar to the head and shoulder pattern. However, it involves a wider point of view. You can trace the wedges by connecting the lowest points over one period of time.
When the two lines approach from the left to the right, you now have a wedge. A bullish wedge denotes a wedge pattern where two lines connecting the upper and lower patterns move downwards right into the chart.
3. Shooting Stars Candlesticks
It is a candlestick and bearish pattern, and it shows up at the end of a price trend with the help of the pattern. The candlesticks have some short body which is situated near the bottom.
On the other hand, there is a long line that extends upwards. With the help of the movement, you can understand the rise and fall of the prices over a period of time. If you follow the red patterns, you will understand the progression.
The upward projected candles show the increased price, and the downward candles show some drift in the prices of the Cryptocurrency.
4. Inverted Hammer
The inverted hammer candlesticks look like shooting stars candlesticks. This time the sticks will downward projected candles. This denotes the fall in the prices of Bitcoins. Here you can understand that the downward price trend bears good signs for the prices because of the inverted projections.
The Patterns Show The Possibilities And Not The Prediction
Keep in mind that the patterns show the possibilities. It does not show any kind of prediction of the prices.
If you thoroughly read the charts, you can read out the patterns of the prices. However, there is no future prediction done through the charts.
Therefore, while you try to read out the patterns, you can have an idea about the trends, but you can not fully reach an end to prejudice or comment something ultimate here. This is the hard and fast rule with the reading of the Crypto charts.
Are you trading on Cryptocurrency without any knowledge of reading Crypto charts? This is like you are alone on a boat and do not know how to swim. There is nothing so harmful as innocence; the same goes for trading Cryptocurrencies. Are you trading with Cryptocurrency? You could facilitate your crypto trading with the help of Crypto profits. This trading app can help you facilitate trading on Crypto safely.
If you have decided to trade on Cryptocurrency, you ought to do your homework. You need to learn how to read the charts. The article discusses the nitty-gritty of reading crypto charts. Therefore stay till the end to know all the things.
What Is A Crypto Chart?
This ought to be your first question with the Cryptocurrency investment. Crypto charts are the graphical representation of the price, the volumes, and the time intervals. There are different types of charts available to you. Though these chart patterns are different from one another, you can understand them with a little knowledge of them.
Parts Of The Crypto Chart
There are distinctive parts of a Crypto chart, and let us take note of these individual elements here.
The trading pair of the Cryptocurrency denotes the base currency (BTC) as well as the quote currency (USDT) that is used in a market. The Crypto chart’s current price denotes the base currency’s price. You understand the rise and the fall of the price is based on a comparison with the price that is kept before 24 hours. These figures change rapidly.
The time increments denote the unit of time. So here you understand the price of Cryptocurrency drifts from one minute to that one month.The Pie chart represents a chart which shows the rise and fall of Cryptocurrency over a period of time.
Patterns Of Crypto Chart
There are some popular Crypto charts that you have to understand how to read them. You need to know how to read these in order to get a good grasp on the movement of prices. Let’s discuss a few of them here.
1. Head And Shoulders
The Head and Shoulder pattern shows the peak and the bottom of one particular trend. When the patterns show a button trend, you can call it an inverted head and shoulder pattern. So try to see these and understand the trends that you have with the patterns.
2. Wedges In Crypto Patterns
The pattern is similar to the head and shoulder pattern. However, it involves a wider point of view. You can trace the wedges by connecting the lowest points over one period of time.
When the two lines approach from the left to the right, you now have a wedge. A bullish wedge denotes a wedge pattern where two lines connecting the upper and lower patterns move downwards right into the chart.
3. Shooting Stars Candlesticks
It is a candlestick and bearish pattern, and it shows up at the end of a price trend with the help of the pattern. The candlesticks have some short body which is situated near the bottom.
On the other hand, there is a long line that extends upwards. With the help of the movement, you can understand the rise and fall of the prices over a period of time. If you follow the red patterns, you will understand the progression.
The upward projected candles show the increased price, and the downward candles show some drift in the prices of the Cryptocurrency.
4. Inverted Hammer
The inverted hammer candlesticks look like shooting stars candlesticks. This time the sticks will downward projected candles. This denotes the fall in the prices of Bitcoins. Here you can understand that the downward price trend bears good signs for the prices because of the inverted projections.
The Patterns Show The Possibilities And Not The Prediction
Keep in mind that the patterns show the possibilities. It does not show any kind of prediction of the prices.
If you thoroughly read the charts, you can read out the patterns of the prices. However, there is no future prediction done through the charts.
Therefore, while you try to read out the patterns, you can have an idea about the trends, but you cannot fully reach an end to prejudice or comment something ultimate here. This is the hard and fast rule with the reading of the Crypto charts.
Disclaimer: This article is not intended to be a recommendation. The author is not responsible for any resulting actions of the company during your trading/investing experience.
You may also like: Stock Market Investing Tips & Guide for Beginners
Image source: Depositphotos.com