Click here to get this post in PDF
Current National Real Estate Trends and Inventory Shifts

The real estate and property market is a vibrant, ever-changing landscape. For anyone looking to buy, sell, invest, or manage property, staying informed about its shifts is critical. We are currently navigating a period of significant transformation, marked by fluctuating inventory, evolving pricing dynamics, and regional market disparities. Understanding these complex movements is key to making sound decisions.
This article aims to unravel the most impactful Real Estate Trends. We will explore everything from national inventory recovery to the rise of ‘refuge markets’. We will also delve into pricing shifts, mortgage rate influences, and the 2026 market forecast.
Furthermore, we’ll examine how commercial and multifamily sectors are evolving, touching on crucial real estate management trends that shape property performance. Our goal is to provide you with clear, actionable insights to help you confidently navigate today’s dynamic property environment.

The national real estate market in early 2026 presents a complex picture of both recovery and lingering challenges. We observe a continued, albeit slowing, increase in active listings, alongside nuanced shifts in new listings and pending sales. These movements collectively paint a detailed portrait of the market’s current momentum.
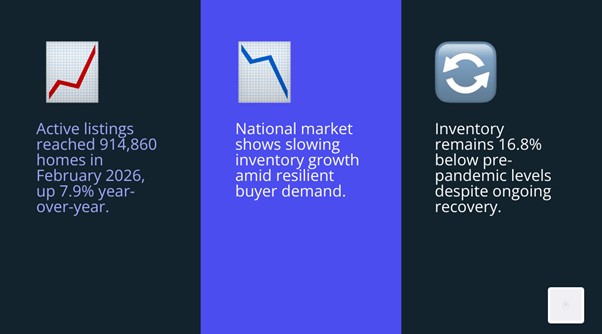
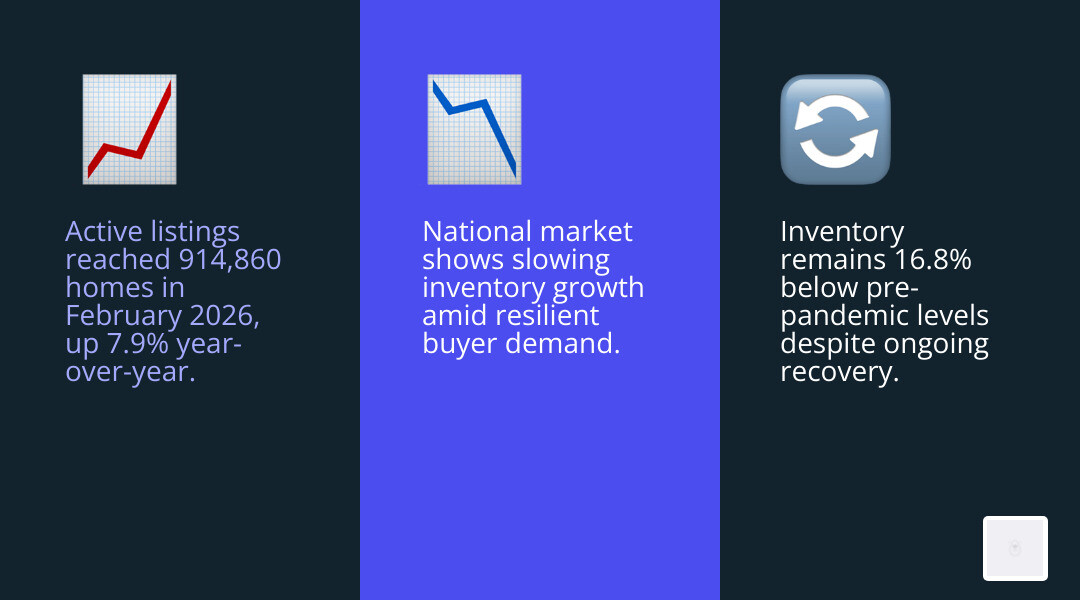
In February 2026, active listings nationwide demonstrated resilience, rising 7.9% year-over-year to 914,860 homes on the market. This marks a sustained period of inventory growth, offering buyers more choices than in recent years. However, this recovery isn’t without its caveats. While the number of available homes has increased, it remains significantly below pre-pandemic levels. For those keen to discover real estate trends and delve deeper into market specifics, resources like EzHomeSearch.com often provide valuable local insights that complement national data.
New listings, a crucial indicator of seller confidence and market replenishment, showed a more mixed performance. In February 2026, new listings rose modestly by 2.4% year over year, totaling 362,180 units. This contrasts with January 2026, when newly listed homes declined by 7.5% year-over-year. This monthly fluctuation is often attributed to seasonal patterns and external factors, such as the severe winter weather that affected January’s figures, particularly in the Northeast.
Pending sales, which reflect buyer demand and contract activity, also offered a glimpse into the market’s pulse. Existing home sales, a measure of closed transactions, rose 1.8% year-over-year in February 2026, reaching 239,910 homes. This improvement suggests a rebound from January’s weaker figures, which were likely influenced by adverse weather conditions. The overall sales pace, however, continues to slow, marking the 23rd consecutive month of this trend.
The term “inventory plateau” accurately describes the current state of recovery. While inventory has grown for 28 consecutive months year over year, the pace of improvement has notably cooled. This suggests that the market is rebalancing, but the path to a fully normalized supply-demand equilibrium is still unfolding.
To better understand the trajectory of these shifts, let’s look at a comparison of key national housing metrics from February 2025 to February 2026:
Metric February 2026 Performance February 2025 Performance Active Listings 914,860 homes (+7.9% YoY) +27.5% YoY (from Feb 2024) Median List Price $403,450 (-2.1% YoY) $412,000 (-0.8% YoY from Feb 2024) Price per Square Foot -1.9% YoY +1.2% YoY Median Days on Market 70 days (+4 days YoY) 66 days (+5 days YoY from Feb 2024) Share of Price Reductions 15.5% (down from 16.8% YoY) 16.8% (up from 14.6% YoY from Feb 2024) Inventory Recovery and Future Real Estate Trends
Despite the recent growth, the journey to a full inventory recovery remains incomplete. While active inventory reached 914,860 homes in February 2026, this figure still sits 16.8% below the typical levels observed between 2017 and 2019, which serve as our pre-pandemic benchmark. This persistent gap indicates that while more homes are available, the market has not fully replenished its supply to the healthier levels seen before the pandemic-induced housing boom.
The slowing pace of inventory gains, after a prolonged period of increases, suggests a more challenging environment for sellers. It highlights a market where buyers, despite improved affordability from lower mortgage rates, are still contending with a supply that lags historical norms. This dynamic continues to influence the delicate balance between supply and demand, shaping pricing strategies and negotiation power across market segments.
The Impact of New Listing Volumes
The volume of new listings is a critical barometer for market health, reflecting both seller willingness and the overall flow of homes onto the market. In February 2026, the 362,180 newly listed units, representing a 2.4% year-over-year increase, signal a cautious return of sellers. This increase, however, follows a notable decline in January 2026, where new listings were down 7.5% year-over-year.
This fluctuation underscores the impact of seasonal trends and external disruptions. For instance, severe winter weather in January likely played a role in dampening listing activity, particularly in regions like the Northeast, where new listings were disrupted by 7.8% year-over-year. As we move past these seasonal effects, seller sentiment will be key. A sustained increase in new listings would indicate growing homeowner confidence in entering the market, potentially easing supply constraints further and fostering a more balanced environment. Conversely, a continued slowdown could exacerbate inventory challenges, particularly in regions already struggling with low supply.
Regional Divergence and the Rise of Refugee Markets
The national real estate narrative often masks significant regional variations, and early 2026 is no exception. We are observing a striking divergence in how different parts of the country are experiencing inventory recovery, price changes, and buyer migration patterns. This regional disparity is a defining characteristic of the current market landscape.
The Northeast, for example, continues to face acute scarcity, with inventory levels remaining a staggering 55.3% below pre-pandemic norms in January 2026. Despite modest 3.8% year-over-year inventory growth in February 2026, this region remains severely undersupplied. In contrast, the West and South are showing stronger signs of recovery. The West saw active inventory increase by 11.3% year-over-year in February 2026 and 12.2% in January 2026. The South, while still slightly below pre-pandemic levels, is much closer to recovery than the Northeast, at just 0.9% below norms in January 2026.
This regional imbalance is also reflected in pricing dynamics. While the national median list price declined, the Northeast saw price per square foot rise by 4.3% year-over-year in January 2026, indicating strong demand in a limited supply environment. This trend is partly driven by the flight to less-expensive ‘refuge markets,’ where buyers seek affordability. Even in traditionally industrial heartlands, we see unique market dynamics. For instance, understanding Detroit furnished real estate trends can reveal how specific local economies and demographics influence housing choices, even as broader national forces play out.
The Midwest, while still 37.8% below pre-pandemic inventory norms in January 2026, shows some resilience in new listings, with a 2.1% year-over-year increase in November 2025. This suggests a more stable, albeit still recovering, market compared to the Northeast’s persistent undersupply.
The Frustrated Seller Phenomenon
A notable trend emerging from the market data is the “frustrated seller” phenomenon, particularly evident in the delisting ratios. In November 2025, the national delisting-to-new listing ratio stood at 0.27. This means that for every 100 new homes listed, 27 previously listed homes were removed from the market without a sale. This ratio, coupled with a 45.5% year-to-date increase in delistings in 2025, suggests that many sellers are struggling to find buyers willing to meet their price expectations, leading them to withdraw their properties.
Contract cancellations, where listings go from pending back to active, contribute to this trend, indicating deals falling through. Metros like Miami, Denver, and Houston have seen some of the highest delisting-to-new-listing ratios, signaling heightened seller frustration in these areas. Miami, for instance, recorded a delisting ratio of 45 per 100 new listings in November 2025. While Denver saw significant year-over-year inventory growth in February 2025 (+64.4%), the high delisting ratio suggests that, even with more homes available, sellers might still be adjusting their expectations to market realities. This dynamic highlights the need for sellers to price competitively and adapt to evolving market conditions.
Identifying Refuge Markets
Amidst the challenges of high mortgage rates and elevated home prices, a new pattern has emerged: the rise of “refuge markets.” These are typically more affordable metropolitan areas experiencing robust price growth, as buyers priced out of more expensive coastal or major urban centers seek better value and lower cost of living. This phenomenon represents a significant geographic reshuffling of demand.
Affordable metros have seen double-digit price-per-square-foot growth since 2022, even as national averages have shown declines. This indicates a strategic adaptation by buyers to the current high-rate environment, prioritizing affordability over proximity to traditional economic hubs. These secondary markets benefit from an influx of buyers seeking to maximize their buying power, which increases competition and puts upward pressure on local home values. This trend highlights how affordability challenges are not uniformly distributed but rather are driving migration patterns and creating new pockets of market strength.
Pricing Dynamics and the 2026 Market Forecast
The interplay of inventory, demand, and affordability has profoundly shaped pricing dynamics in early 2026, setting the stage for the year ahead. We’ve observed a subtle but significant shift in median list prices, alongside continued price reductions, indicating a market in rebalance.
In February 2026, the national median listing price decreased 2.1% year over year to $403,450. This dip, coupled with a 1.9% decline in price per square foot, suggests a cooling in the rapid price appreciation seen in previous years. Furthermore, 15.5% of active listings had price reductions in February 2026, a slight improvement from 16.8% a year prior. Notably, the Northeast region saw the lowest incidence of price reductions at 8.4%, reinforcing its unique supply-constrained pricing environment.
Several factors are influencing 2026 home values:
- Mortgage Rates: Expected to stabilize, improving affordability and buyer confidence.
- Inventory Levels: Continued growth, albeit slower, offers more choice and tempers price increases.
- Buyer Demand: Influenced by affordability, wages, and economic stability.
- Economic Growth: A stable economy supports employment and consumer spending, underpinning housing demand.
- Regional Shifts: Migration to more affordable areas continues to drive price dynamics in refugee markets.
For prospective homeowners, changes in monthly mortgage payments are a critical consideration. The typical U.S. home value stood at $361,371 in February 2026, up 0.1% month over month and 0.4% year over year. Crucially, the typical monthly mortgage payment fell 7.7% year over year to $1,738, reflecting improved affordability.
How Mortgage Rates Shape Real Estate Trends
Mortgage rates remain a pivotal factor shaping buyer activity and market forecasts for 2026. The Realtor.com forecast for 2026 anticipates mortgage rates to average around 6.3%. This stabilization following periods of volatility is a key driver of improved affordability. Lower rates have significantly enhanced buying power, with a median-income household experiencing about a $30,000 increase in its purchasing power over the past year.
However, the “rate lock-in effect” continues to influence market dynamics. A substantial portion of existing homeowners, approximately four out of five, currently enjoy mortgage rates below 6%. This disincentivizes them from buying and selling a new home at a higher rate, thereby limiting turnover of existing inventory.
The broader economic landscape, including Federal Reserve policy, also plays a crucial role. Concerns about potential policy missteps—either remaining too restrictive or easing prematurely—are ever-present. Additionally, the Federal Reserve will undergo a leadership transition as Jerome Powell’s chairmanship concludes on May 15, 2026, adding another layer of uncertainty to the economic outlook that could indirectly affect mortgage rates. As spring approaches, the question remains whether these stabilizing rates will spur a significant increase in buyer or seller activity, or if the market will continue its gradual rebalancing.
Time on Market and Sales Pace
The time homes spend on the market reflects buyer demand and market competitiveness. In February 2026, homes spent a median of 70 days on the market nationally. This represents an increase of 4 days compared to a year ago and marks the 23rd consecutive month of a slowing sales pace. This extended market time indicates that buyers have more time to deliberate and negotiate, shifting some leverage in their favor.
This prolonged sales cycle suggests a market that is moving away from the frenzied pace of previous years and settling into a more normalized, albeit slower, rhythm. The absorption rate, or how quickly available homes are sold, is adjusting to reflect this new reality. As homes sit longer on the market, sellers may become more amenable to price adjustments or concessions, contributing to overall market rebalancing. This trend underscores the importance of sellers pricing their homes strategically and of buyers being patient and prepared for negotiation.
Commercial and Multifamily Sector Evolution
Beyond the residential sphere, the commercial and multifamily real estate sectors are also undergoing significant transformations, driven by evolving work patterns, technological advancements, and shifting demographic trends. These changes present both challenges and opportunities for investors and property managers.
The office market, in particular, continues to exhibit a pronounced bifurcation. We observe widening gaps between prime, high-quality office spaces and older, less desirable assets. While some markets show positive rent growth for prime assets, the overall multitenant vacancy rate remains elevated. For example, in Minneapolis, multitenant vacancy increased to 24.7% in Q4 2025, up from 24.3% in the previous quarter. This indicates a flight to quality, as tenants seek modern, amenity-rich spaces, leaving older buildings struggling.
Meanwhile, the industrial sector is experiencing robust demand, driven in part by the explosive growth of AI and data centers. This “AI-driven data center expansion generates spillover demand for industrial space from suppliers of cooling, power, and equipment,” creating new opportunities for industrial property owners. These Basin Street real estate management trends highlight the importance of adapting to technological shifts and understanding their ripple effects across different property types.
Multifamily Market Stabilization
The multifamily market is showing signs of stabilization, though the pace of rent growth recovery is varied across regions. The 2026 forecast anticipates a -1.0% change in rent growth nationally. While the typical rent nationwide was $1,895 in February 2026, representing a 1.9% year-over-year increase according to the Zillow Observed Rent Index (ZORI), the broader trend points towards softening.
A significant indicator of this rebalancing is the prevalence of rental concessions. In February 2026, 39.2% of rental listings offered concessions, down slightly from 40.1% year-over-year. This suggests that while landlords are still offering incentives, the intensity might be easing. The softening rental market, particularly concentrated in the South and West, creates mobility opportunities for renters seeking more affordable options. These regions, having seen substantial new construction, now offer more supply, allowing renters greater choice and potentially better value.
Industrial and Data Center Growth
The industrial and data center sectors are experiencing a period of intense growth and strategic investment. The demand for logistics and warehousing remains strong, driven by e-commerce and evolving supply chain strategies. However, it’s the data center segment that truly stands out.
The expansion of AI technologies is a primary catalyst for this growth, creating substantial spillover demand for industrial spaces. Companies supplying cooling equipment, power infrastructure, and specialized hardware are actively seeking industrial properties. This growth, however, is not without its constraints. Power delivery timelines and supply chain issues are limiting the pace of new data center development. Despite these challenges, demand remains exceptionally high, with preleasing rates consistently above 75% in primary data center markets. This highlights the critical need for continued infrastructure investment and strategic development to meet the escalating requirements of the digital economy.
Frequently Asked Questions about Real Estate Trends
What is the 2026 forecast for home prices and sales volume?
For 2026, Realtor.com forecasts a modest 2.2% year-over-year increase in home prices. Existing-home sales are projected to increase by 1.7%, reaching approximately 4.13 million units. Mortgage rates are expected to average around 6.3% throughout the year, and inventory is anticipated to grow by 9% year-over-year.
How does current inventory compare to pre-pandemic levels?
As of February 2026, national active listings remain 16.8% below the typical levels observed between 2017 and 2019. While inventory has been recovering, the pace has slowed, and significant regional disparities exist. For instance, in January 2026, the Northeast’s inventory was still 55.3% below pre-pandemic norms, while the South was only 0.9% below.
Why are delisting rates increasing in certain major metros?
Increasing delisting rates, such as the national delisting-to-new listing ratio of 0.27 in November 2025, indicate a “frustrated seller” phenomenon. This typically occurs when sellers are unable to find buyers willing to meet their asking prices or desired terms. Metros like Miami, Denver, and Houston have shown some of the highest delisting ratios, suggesting that sellers in these markets are more frequently withdrawing their properties than accepting offers below their expectations, reflecting a shift in market dynamics and buyer-seller leverage.
Conclusion
The real estate market in early 2026 is characterized by a dynamic interplay of recovery, rebalancing, and regional divergence. While national inventory continues its upward trend, the pace has slowed, indicating a plateau in recovery relative to pre-pandemic norms. Pricing adjustments, influenced by stabilizing mortgage rates and improved affordability, are creating a more nuanced environment for both buyers and sellers. The rise of refugee markets and the frustrated seller phenomenon underscore the importance of adapting to localized conditions and evolving buyer preferences.
In the commercial and multifamily sectors, we observe distinct trends, from the bifurcation of the office market to the robust, AI-driven growth of industrial and data center properties. These shifts highlight the need for strategic adaptation and informed decision-making across all segments of the property market. As we move further into 2026, the market appears to be settling into a more balanced territory, yet economic risks and policy changes will continue to shape its trajectory. Navigating these complex Real Estate Trends requires continuous insight and a proactive approach to ensure long-term stability and success.
For those looking to optimize their property investments and management strategies, understanding these broader market forces is paramount. We encourage you to explore resources on asset management, property management, and property services to ensure your real estate endeavors are well-positioned for the future.
Also read: Balancing Risk and Growth: Strategic Asset Allocation for Commercial Real Estate
