Click here to get this post in PDF
National Trends and the 2026 Real Estate Growth Outlook
The real estate landscape in April 2026 presents a nuanced picture. After years of unprecedented shifts, we are now witnessing a period of market normalization. This includes a notable thaw in what has been termed “The Great Stay,” as homeowners show increased mobility.
Inventory recovery is a critical theme, but it unfolds unevenly across the nation. Understanding these dynamics is essential for buyers, sellers, investors, and industry professionals alike. We delve into the crucial factors shaping this evolving market.
This article will explore the diverse facets of real estate growth in 2026. We will analyze national housing trends, dissect regional variances, and uncover opportunities within commercial real estate sectors. We also examine factors influencing affordability and the challenges that remain.
Navigating this complex environment requires not only keen market insight but also efficient operations. Implementing Digital Maverick ISA growth can be a differentiator for success. Throughout our analysis, we will highlight the four key signals defining the 2026 housing market: inventory, prices, mortgage rates, and sales volume.
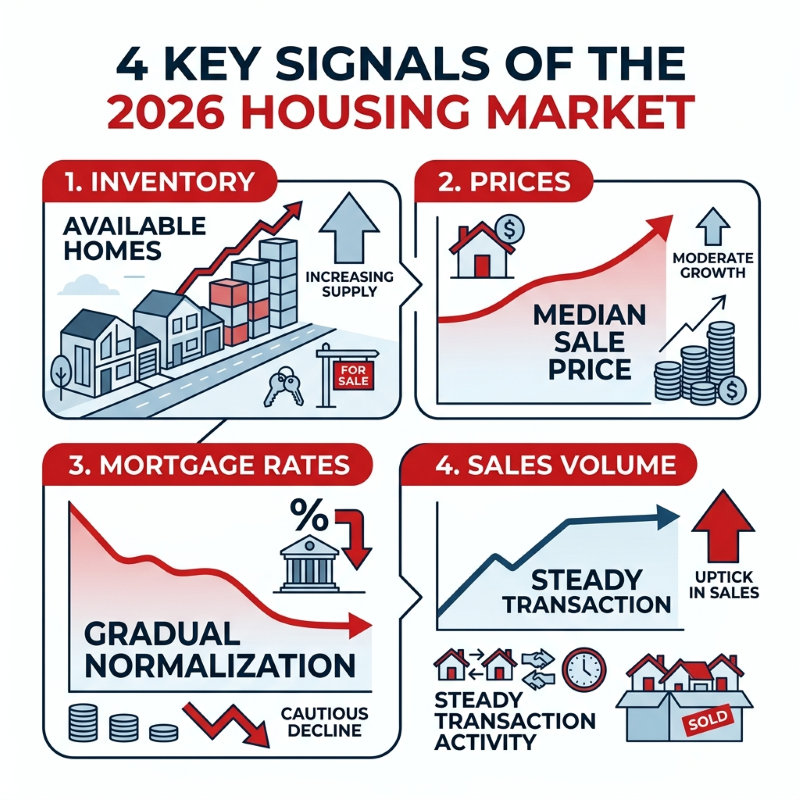
As we move through early 2026, the U.S. housing market is demonstrating a cautious yet discernible path toward stabilization. National trends indicate a gradual rebalancing, characterized by modest price appreciation, increasing inventory, and a slight uptick in sales volume. This period marks a departure from the frenetic pace of previous years, offering a more measured environment for both buyers and sellers.
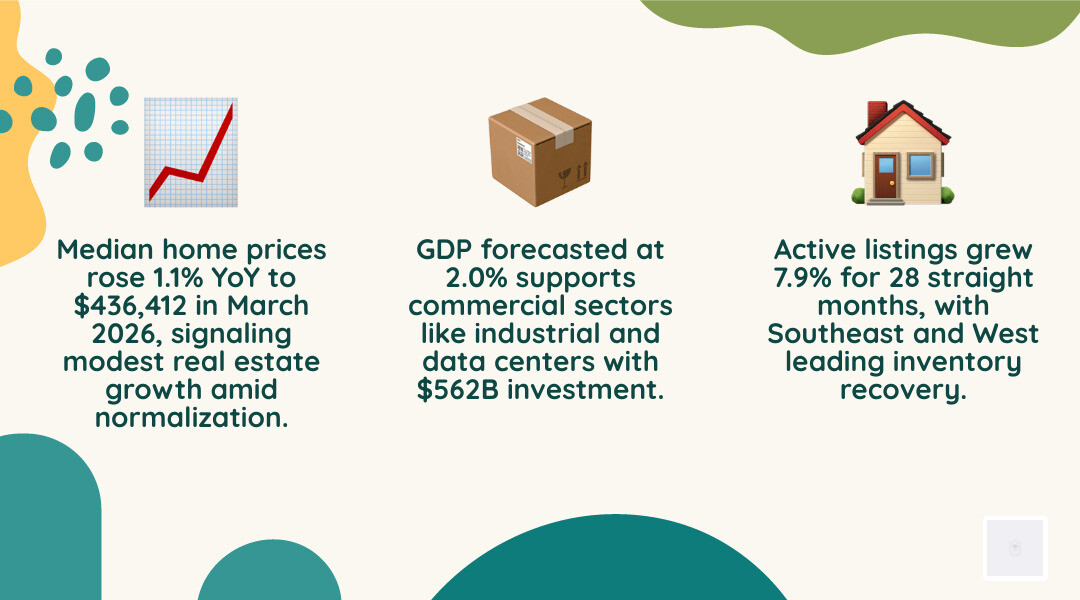
The median sale price for homes nationwide reached $436,412 in March 2026, reflecting a 1.1% year-over-year increase. While this growth is positive, it signifies a cooling from the double-digit percentage gains observed during the peak of the pandemic-fueled housing boom. This moderation in price growth is a welcome sign for affordability, as it allows incomes to catch up.
Inventory levels are also showing encouraging signs of recovery. Active listings rose by 7.9% year-over-year in February 2026, marking the 28th consecutive month of gains. However, the pace of this growth has decelerated over the past nine months, suggesting that while more homes are available, the market isn’t being flooded. This steady increase in supply provides buyers with more options and reduces the intense competition that defined earlier periods.
Sales volume, though still below historical highs, is beginning to improve. Home sales were up 2.0% year-over-year in March 2026, totaling 414,173 transactions. This modest increase aligns with projections for the full year, with forecasts suggesting approximately 4.25 million home sales in 2026, representing a 5% increase from 2025. Mortgage rates have stabilized around an average of 6.2% for a 30-year fixed mortgage, down from higher peaks, which is contributing to renewed buyer confidence.
The overall sentiment is one of cautious optimism. The market is not experiencing a dramatic correction, but rather a slow and steady return to more sustainable conditions. This environment rewards informed decision-making and strategic planning.
Here’s a snapshot of key housing metrics:
Metric 2025 (Approx. Avg/End) March 2026 (Current) Forecast 2026 (Full Year) Median Sale Price (National) $410,100 (Q3) $436,412 +0.5% to +2.2% YoY Year-over-Year Price Change Varies +1.1% +0.5% to +2.2% Total Home Sales ~4.05 million 414,173 (March) 4.13 to 4.25 million Year-over-Year Sales Change Varies +2.0% +1.7% to +5% 30-Year Fixed Mortgage Rate Varies 6.2% 5.9% to 6.9% (avg 6.4%) Active Listings (YoY Change) +12.1% (Dec) +7.9% (Feb) +8.9% to +10% For a deeper dive into the latest market statistics, refer to the March 2026 Housing Market Data.
Analyzing Price Discrepancies: FRED vs. Redfin
When examining national home price data, it’s common to encounter varying figures from different sources, which can sometimes lead to confusion. A prime example is the discrepancy between the median home price reported by FRED (Federal Reserve Economic Data) and real estate platforms like Redfin.
FRED’s Median Sales Price of Houses Sold for the United States (MSPUS) data, sourced from the U.S. Census Bureau and HUD, reported a median of $405,300 for Q4 2025. In contrast, Redfin’s March 2026 median sale price was $436,412. This difference of over $31,000 might seem significant, but it’s largely attributable to methodological distinctions and reporting timelines.
FRED’s MSPUS data is released quarterly and is not seasonally adjusted. It represents a broader, more historical view of the market, often with a reporting lag inherent in government data collection. The Q4 2025 figure, for instance, encompasses sales that closed throughout that quarter, reflecting market conditions from several months prior. This type of data is invaluable for long-term economic analysis and understanding foundational market trends. You can explore this official data at the Median Sales Price of Houses Sold for the United States (MSPUS) page.
Redfin, on the other hand, provides real-time, monthly data based on actual sales transactions occurring within that specific month. Their March 2026 figure captures the most current market fluctuations and buyer activity. This immediate snapshot can reflect seasonal upticks, recent shifts in buyer demand, or the impact of current mortgage rates more swiftly than quarterly government reports. Additionally, Redfin’s data may include a different mix of housing types or geographic areas within its aggregation, contributing to the variance.
Essentially, FRED offers a foundational, historical benchmark, while Redfin provides a more agile, current market pulse. Both are valuable, but they serve different analytical purposes and capture market dynamics at different speeds.
Forecasts for the Remainder of 2026
Looking ahead to the rest of 2026, industry experts largely anticipate a period of stability and modest growth, albeit with varying degrees of optimism. The consensus points to a market that is finding its equilibrium after years of volatility.
J.P. Morgan’s outlook for 2026 suggests that national home prices are expected to largely stall, with a forecast of 0% growth for the year. Their analysis highlights that while demand may improve due to factors like lower adjustable-rate mortgage (ARM) rates and builder incentives, these will primarily offset existing supply pressures. They note that the prevalence of 30-year fixed-rate mortgages has historically kept prices high by discouraging homeowners from moving, limiting inventory.
Compass Intelligence, in their 2026 Real Estate Market Outlook, offers a slightly more positive, yet still conservative, projection. They anticipate home prices to rise modestly by about 0.5% nationally. Their forecast emphasizes that incomes are expected to grow faster than home prices, which is a crucial factor in improving overall affordability for prospective buyers. They also project that home sales will reach approximately 4.25 million units, representing a 5% increase from 2025, signaling a meaningful rebound in transaction activity.
Realtor.com’s 2026 Housing Forecast aligns with this theme of gradual improvement. They predict a 2.2% year-over-year increase in home prices and a 1.7% rise in existing-home sales, reaching 4.13 million units. Their forecast also places the average 30-year fixed mortgage rate at 6.3% for the year. Realtor.com emphasizes that while the market won’t be “off to the races,” it will offer a steadier environment compared to recent years, with a shift towards more balanced conditions for buyers and sellers.
These forecasts collectively paint a picture of a housing market that is normalizing. The expectation of flat to modest price growth, coupled with increasing sales volume and stabilizing mortgage rates, suggests an environment where strategic decisions, rather than speculative gambles, will yield the best results. For more detailed insights into these projections, the Realtor.com 2026 Housing Forecast offers comprehensive analysis.
Regional Divergence: Benchmarkets and High-Growth Metros
While national trends provide a broad overview, the true story of real estate growth in 2026 is told through its regional and metropolitan variations. The market is far from uniform, with some areas experiencing robust expansion while others navigate slower recoveries or unique challenges. Understanding these regional divergences is crucial for investors, developers, and individuals looking to make informed decisions.
Industry surveys, such as PwC’s U.S. real estate markets to watch 2026, highlight distinct leaders in real estate prospects. The Southeast region, for instance, continues to stand out, boasting the highest average real estate prospects score of 2.90. This reflects strong investor confidence driven by population growth, economic diversification, and a favorable business climate.
Within this dynamic landscape, certain metros consistently emerge as hotspots for real estate growth and investment. Dallas/Fort Worth has maintained its position as a top market, leading all others for real estate prospects in 2026. Its economic resilience, diverse job market, and strong net buy recommendations for sectors like retail and industrial make it a magnet for capital. Other notable markets include Jersey City, Miami, Brooklyn, and Houston, which are attracting significant attention for their unique growth drivers. For those interested in high-end properties and investment opportunities in the region, exploring Miami luxury real estate growth can provide valuable insights into this vibrant market.
PwC’s analysis also introduces the concept of “Primary Markets,” defined as metropolitan areas with over 3 million total payroll employment. These larger, more established markets show even stronger prospects, with an average score of 3.08. This suggests that while smaller, emerging markets offer potential, the foundational strength and scale of primary markets continue to offer compelling investment opportunities. The report, titled “U.S. real estate markets to watch 2026: PwC,” provides a comprehensive overview of these trends, helping to distinguish between “benchmarkets” that mirror broader regional trends and “outlier” markets driven by unique local factors.
Inventory Recovery and the North-South Divide
The recovery of housing inventory across the U.S. is proceeding, but it’s far from a homogenous process. February 2026 data shows active listings climbing by 7.9% year-over-year, marking the 28th consecutive month of gains. However, this growth has been decelerating for nine straight months, indicating a plateauing in the pace of inventory expansion. More importantly, stark regional divides characterize this recovery, creating distinct market conditions across the country.
The Northeast, for example, continues to grapple with significant supply constraints. While it saw a 3.8% year-over-year increase in active listings in February, this is considerably lower than other regions and often insufficient to meet demand. This limited supply contributes to continued competition and slower inventory recovery compared to pre-pandemic levels.
In contrast, the South and West are leading the charge in inventory expansion. The West experienced an 11.3% year-over-year increase in active listings, and the Midwest saw a 10% rise, followed by the South at 6.9%. This regional disparity is creating a more buyer-friendly environment in many Southern and Western metros. Metros like Seattle saw a remarkable 38.5% increase in inventory year-over-year, Louisville was up 27.3%, and San Jose experienced a 24.8% surge. These areas are seeing a significant influx of new listings and a longer time on market, shifting bargaining power towards buyers.
Some markets, such as Denver, San Antonio, Seattle, and Austin, now boast over 50% more inventory than their pre-pandemic norms, signaling a substantial rebalancing. This uneven recovery highlights the importance of granular, local market analysis. National averages can obscure these critical regional differences, making it essential for stakeholders to consult detailed reports like the February 2026 Monthly Housing Report to understand specific market dynamics.
Migration Patterns Influencing Real Estate Growth
Migration trends continue to be a powerful force shaping regional real estate growth in 2026, redistributing population and economic activity across the United States. The pandemic initially accelerated these shifts, and while the intensity may have moderated, the underlying patterns persist, creating distinct winners and losers in the housing market.
States in the Sun Belt, particularly Florida, Arizona, North Carolina, Tennessee, and South Carolina, continue to experience significant inbound migration. These states are attracting residents with promises of lower costs of living, warmer climates, and growing job markets, especially in tech and manufacturing. This influx of new residents fuels demand for housing, both residential and rental, and supports robust construction activity. Phoenix, for example, has seen an 81% increase in home values over the last decade, partly due to its appeal as a migration destination. Austin, another tech hub, continues to gain over 150 new residents daily, putting constant pressure on its housing supply.
Conversely, states like California, New York, Illinois, Washington, and Maryland are experiencing consistent outbound migration. High costs of living, elevated taxes, and a desire for more space are driving residents to seek opportunities elsewhere. While these states remain economic powerhouses, the outflow of population can temper housing demand and put downward pressure on prices in certain submarkets. Top origins for out-migration often include major metropolitan areas like Los Angeles and New York.
These migration patterns have profound implications for real estate. In inbound markets, sustained demand supports home price appreciation and rental growth, making them attractive for investment and development. In outbound markets, while overall prices may remain high due to existing wealth, the reduced demand can lead to longer days on market and more balanced conditions for buyers. Understanding these demographic shifts is key to anticipating future market performance and identifying areas with sustainable growth potential.
Commercial Real Estate Growth and Sector Opportunities
The commercial real estate (CRE) market in 2026 is poised for a significant rebound, demonstrating resilience despite broader economic slowdowns. After a period of adjustment, investment activity is projected to increase substantially, driven by strategic capital deployment and a focus on income-generating assets.
According to CBRE’s 2026 U.S. Real Estate Market Outlook, commercial real estate investment activity is expected to surge by 16% this year, reaching an impressive $562 billion. This figure nearly matches the annual average seen between 2015 and 2019, signaling a strong return to pre-pandemic investment levels. This optimism comes even as U.S. GDP growth is forecasted to slow to 2.0% in 2026, indicating that CRE returns will be primarily income-driven rather than reliant on rapid capital appreciation.
A key trend in the CRE landscape is the anticipated compression of cap rates by 5-15 basis points across most property types. This suggests that investors are willing to accept lower initial yields for high-quality assets, reflecting increased confidence in the long-term stability and income potential of commercial properties. The market is shifting towards a “flight to quality,” where prime assets command premiums, while non-prime properties may offer opportunities for creative deals and value-add strategies.
This environment presents diverse opportunities across various sectors, each with its unique drivers and challenges.
Industrial and Retail Resilience
Within the commercial real estate sector, industrial and retail properties are demonstrating notable resilience and strategic growth opportunities in 2026.
The industrial sector continues its strong performance, driven by fundamental shifts in global supply chains and consumer behavior. The trends of reshoring manufacturing operations back to the U.S. and the increasing reliance on 3PL (third-party logistics) outsourcing are fueling demand for modern, efficient warehouse and distribution facilities. This has led to a “flight to quality,” where newer, technologically advanced industrial spaces are highly sought after, often at the expense of older, less efficient assets. The strategic importance of logistics and e-commerce fulfillment ensures sustained investment and development in this sector.
The retail sector, which faced significant headwinds during the pandemic, is also showing signs of robust recovery and adaptation. While traditional big-box retail continues to evolve, specific segments are thriving. Grocery-anchored retail centers remain highly desirable due to their essential nature and consistent foot traffic. Additionally, discount retailers and service-oriented businesses (e.g., healthcare clinics, fitness centers, personal care services) are expanding, capitalizing on consumer demand for convenience and value. This sector’s growth is increasingly localized and dependent on strong demographic fundamentals.
The healthcare sector, while not typically grouped with industrial and retail, also presents unique opportunities. After a period of high construction, completions of new healthcare facilities are expected to drop sharply, leading to a stabilization of vacancies. This normalization will support rent growth and investment in medical office buildings and specialized healthcare properties, driven by an aging population and ongoing demand for medical services.
Data Centers and Multifamily Dynamics
Two other commercial real estate sectors, data centers and multifamily housing, are exhibiting distinct and compelling dynamics in 2026, reflecting both technological advancements and evolving residential needs.
Data centers are experiencing unprecedented demand, with leasing activity projected to hit all-time highs. The explosion of artificial intelligence, cloud computing, and digital transformation initiatives across all industries is creating an insatiable need for digital infrastructure. However, the supply of new data centers is severely constrained, primarily by the lengthy timelines required to secure sufficient power and land. This scarcity is driving up lease rates and making existing, well-located data center assets highly valuable, attracting significant investment.
The multifamily sector, while still fundamentally strong, is navigating a more nuanced landscape. Positive net demand for rental units continues, supported by demographic trends and ongoing affordability challenges in the for-sale housing market. However, in some regions, particularly the Sun Belt and parts of the Midwest, a surge in new construction completions has led to an increase in unleased units. This temporary oversupply in certain submarkets has shifted the focus for multifamily landlords towards tenant retention. Strategies that prioritize resident satisfaction, community amenities, and flexible leasing terms are becoming paramount to maintain occupancy and rental income. Despite these localized challenges, the long-term outlook for multifamily remains positive, driven by sustained renter demand.
For those looking at residential investment opportunities within high-growth regions, understanding the interplay between single-family and multifamily markets is key. For example, in markets like Las Vegas, which has seen significant population growth and investment, the dynamics of both home prices and rental demand are closely linked.
Overcoming Affordability and Inventory Challenges
Affordability has been a persistent hurdle in the U.S. housing market for several years, but 2026 is showing signs of improvement. This isn’t necessarily due to widespread price declines, but rather a combination of factors that are slowly rebalancing the equation for prospective buyers.
A primary driver of improved affordability is income growth outpacing home price appreciation. With home prices projected to rise modestly by 0.5% to 1.1% in 2026, and incomes growing at a faster clip, the critical price-to-income ratio is starting to normalize. This means that while homes are still expensive, a larger portion of a household’s income can be allocated to housing costs without as much strain.
Furthermore, stabilizing and slightly declining mortgage rates are playing a crucial role. After peaking, 30-year fixed mortgage rates have settled around an average of 6.2% to 6.4%, making monthly payments more manageable than when rates were higher. This reduction in financing costs directly translates to increased purchasing power for buyers.
Builders are also contributing to enhanced affordability through various incentives. “Builder buydowns,” where developers subsidize a buyer’s mortgage rate for the initial years, are becoming more common, offering reductions of 100-200 basis points below prevailing rates. These incentives make new construction an increasingly attractive option, especially for first-time homebuyers. In fact, when adjusted for inflation, real home prices are expected to decline slightly, further aiding affordability. This multifaceted approach to affordability improvement is a key theme for the 2026 market, as highlighted by various market outlooks.
Strategic Systems for Sustained Real Estate Growth
In a market characterized by nuanced shifts and increasing competition, leveraging strategic systems and operational efficiency is paramount for sustained real estate growth. Real estate professionals and firms must optimize their processes to capitalize on emerging opportunities and navigate challenges effectively.
One critical aspect is effective lead management strategies. With “shadow demand” evident in purchase mortgage applications rising 15-25% year-over-year, there’s a significant pool of potential buyers and sellers. However, converting this demand requires sophisticated systems for lead generation, nurturing, and conversion. This is where advanced tools and dedicated support, such as those that contribute to Digital Maverick ISA growth, can make a substantial difference. By streamlining the initial contact and qualification process, agents can focus on high-value interactions.
The concept of “shadow inventory” also plays a role. Nearly 60% of listings were withdrawn by November 2025, indicating a backlog of potential sellers waiting for optimal market conditions. Proactive outreach and relationship building with these homeowners, facilitated by robust CRM systems and automated follow-up sequences, can unlock future listing opportunities. Data access and speed to lead are defining factors for success, enabling investors and agents to act quickly on quality information, whether it’s pre-probate lists or rental yield analytics.
Operational efficiency extends beyond lead generation to include administrative support, tenant management (for investors), bookkeeping, and marketing. Outsourcing these tasks to virtual assistants or implementing comprehensive software solutions frees up time for core business activities, allowing professionals to scale their operations without proportional increases in overhead. The ability to manage data, automate routine tasks, and maintain consistent client communication through strategic systems will be a key differentiator for those aiming for significant growth in 2026.
Risks and Economic Headwinds
Despite the generally positive outlook for real estate growth in 2026, several risks and economic headwinds could temper the market’s trajectory. Vigilance and adaptability will be crucial for navigating these potential challenges.
Geopolitical uncertainty remains a significant concern. Events such as the conflict in Iran, as noted in Realtor.com’s March 2026 report, can abruptly shift the global economic backdrop. Such conflicts can lead to spikes in energy prices, disruptions in supply chains, and broader economic instability, all of which can impact consumer confidence and mortgage rates.
Economic uncertainty, even with a forecasted U.S. GDP growth of 2.0% in 2026, still presents risks. A slower-than-expected economic expansion could lead to job market softening, reducing consumer purchasing power and dampening housing demand. Inflationary pressures, while moderating, could also resurface, potentially prompting the Federal Reserve to maintain higher interest rates for longer, impacting affordability.
Overbuilding risks are localized but significant, particularly in some Sun Belt and West Coast markets that experienced rapid construction booms. J.P. Morgan’s analysis points out that regional house price declines are often tied to excess new construction. If supply outpaces demand too aggressively in these areas, it could lead to increased vacancies, longer days on market, and localized price corrections.
Finally, policy impacts, while often less impactful than anticipated, bear watching. Discussions around policies such as banning institutional investors from the single-family home market or large-scale mortgage-backed securities (MBS) purchases could create ripples. However, experts like J.P. Morgan suggest that the actual market impact of such policies might be minimal. For instance, institutional investors comprise only 1-3% of the single-family market, and even substantial MBS purchases might only reduce yields by a modest 10-15 basis points, given the market’s scale. Nonetheless, the perception and initial market reaction to policy changes can still introduce short-term volatility.
Frequently Asked Questions about Real Estate Growth
Why do median home price reports from FRED and Redfin differ so significantly?
The significant difference between median home price reports from FRED (Federal Reserve Economic Data) and Redfin stems primarily from their data collection methodologies and reporting timelines. FRED data, such as the Q4 2025 median of $405,300, utilizes quarterly, non-seasonally adjusted figures sourced from the U.S. Census Bureau and HUD. This data often reflects a lag, providing a broader, more historical view. In contrast, Redfin’s figures, like the March 2026 median of $436,412, are based on real-time, monthly actual sales transactions. Redfin’s data captures current market fluctuations and buyer activity much more swiftly, leading to higher, more up-to-the-minute medians.
Which U.S. cities are the top markets for investment in 2026?
According to industry surveys, including PwC’s Emerging Trends in Real Estate, Dallas/Fort Worth leads the nation as the top market for investment and development prospects in 2026. Other highly ranked cities include Jersey City, Miami, Brooklyn, and Houston. These metros are driven by factors such as strong economic diversification, robust job growth, favorable demographics, and significant investment in key commercial sectors like industrial and retail.
How is affordability improving if home prices are still rising?
Affordability in 2026 is improving not necessarily because home prices are falling across the board, but due to several converging factors. Firstly, income growth is now outpacing the modest 0.5% to 1.1% rise in home prices, which makes housing more attainable relative to earnings. Secondly, stabilizing and slightly declining mortgage rates (averaging around 6.4%) reduce monthly housing costs. Lastly, increased builder incentives, such as mortgage rate buydowns (offering 100-200 basis point reductions), are making new construction more accessible and contributing to overall affordability gains for buyers.
Conclusion
As we navigate April 2026, the U.S. real estate market is clearly in a phase of rebalancing and normalization. The narrative of real estate growth is no longer one of explosive, unsustainable gains, but rather of strategic, uneven, and ultimately more sustainable expansion. We are witnessing a market that is steadily finding its footing, characterized by modest price appreciation, a gradual replenishment of inventory, and a cautious but positive uptick in sales volume.
The regional “benchmarks” and “outliers” underscore the importance of granular analysis, revealing that national averages often mask the diverse realities on the ground. While the Southeast and specific metros like Dallas/Fort Worth continue to lead in growth prospects, other areas are experiencing their own unique recoveries, driven by migration patterns and local economic fundamentals.
Commercial real estate is poised for a strong rebound, with significant investment flowing into resilient sectors like industrial and retail, alongside high-demand areas such as data centers. The challenges of affordability are being addressed through a combination of income growth, stabilizing mortgage rates, and innovative builder incentives, rather than through widespread price corrections.
However, the market is not without its risks. Geopolitical events, economic uncertainties, and localized overbuilding could still introduce volatility. For real estate professionals and investors, success in this evolving landscape hinges on a deep understanding of these nuanced trends, coupled with the implementation of efficient, scalable systems for lead management and operational excellence. The market of 2026 demands not just insight, but also a proactive and professional approach to leverage its opportunities and mitigate its challenges.

This period marks a transition to a more mature and balanced real estate environment, where informed decisions, strategic planning, and a commitment to understanding local dynamics will define long-term success.
You may also like:
Redwood Shores: A Premier Waterfront Community for Modern Living
Why Celina, Texas, is North Texas’ Premier Place to Call Home
The Serra Residences Allows Up to 36 Storeys and 143,906 sq ft GFA
